基于 Prometheus 监控告警
Table of Contents
1. 监控架构
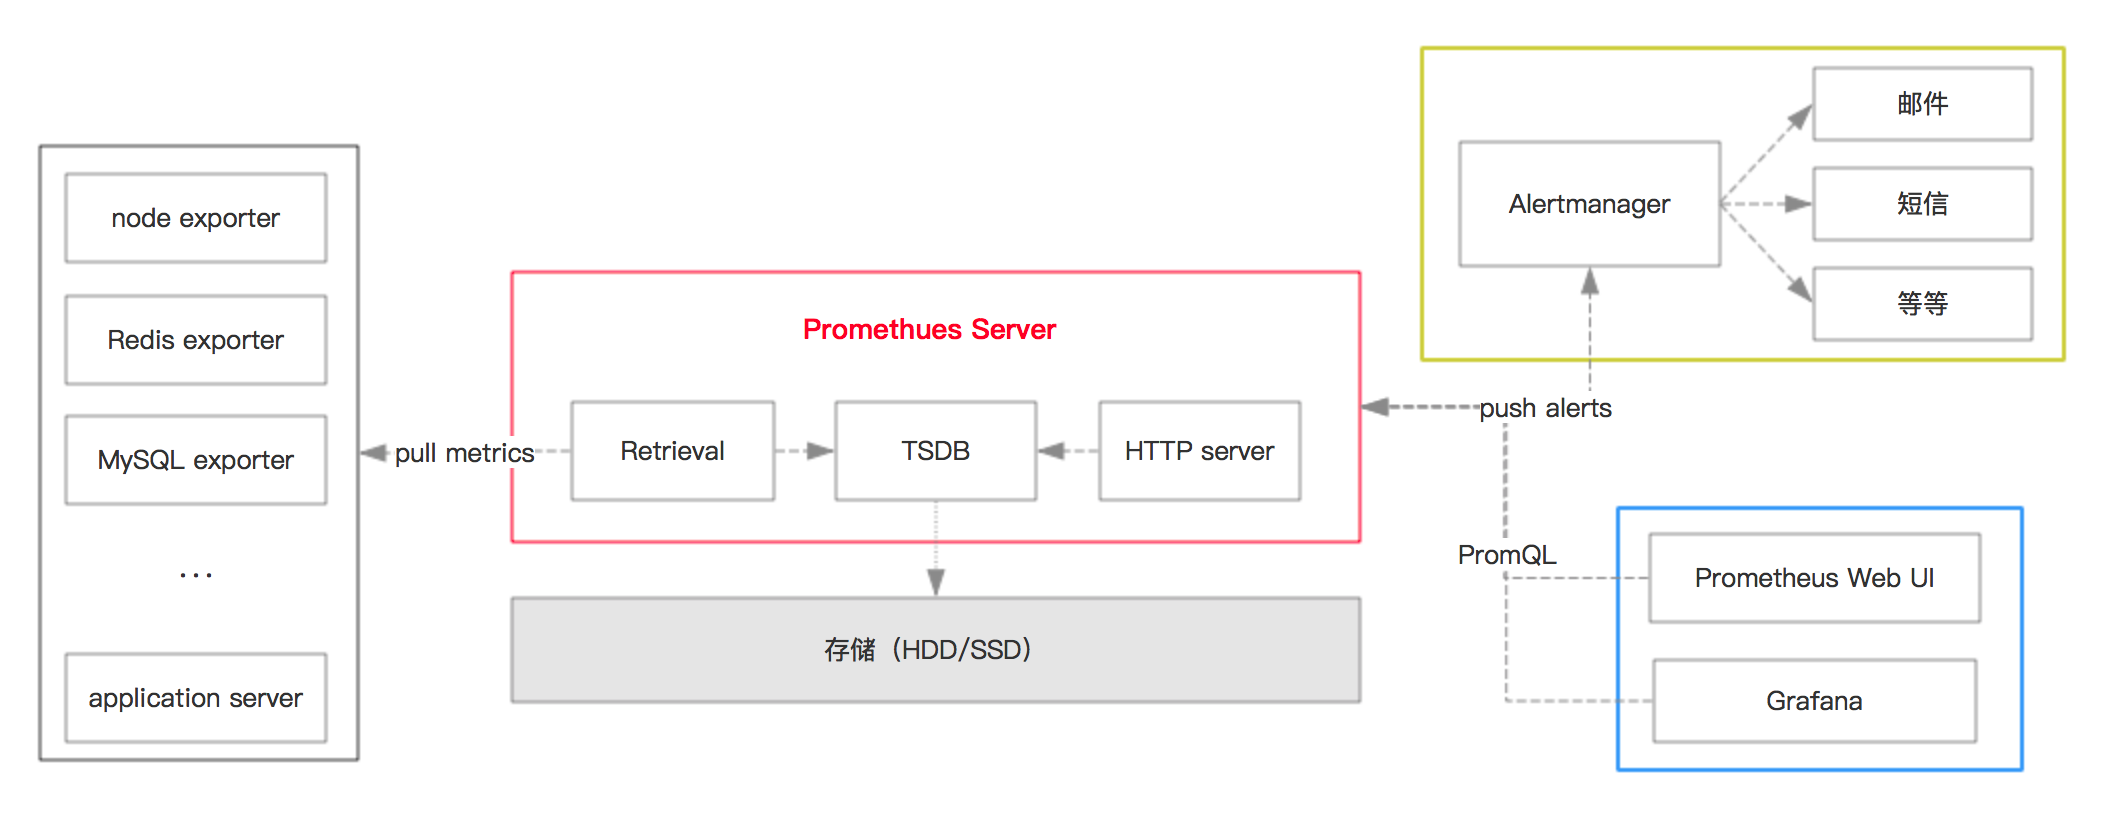
这是一个常规的监控架构,从 metrics 生成、收集、到查询展示。
1.1. 生成度量指标(metric)
Prometheus 提供了各种 exporter,常见的系统和一些开源框架框架都已经支持。 比如我们常用的:Node(系统主机)、MySQL、Redis、Kafka、Ceph、HAProxy,尤其是云原生相关的系统支持更加完备。
自己的 API server 对接需要使用 clientlibs,自己也可以 写 exporter。
1.2. metrics 收集
Prometheus 中包含 TSDB(时间序列 DB),用作数据存储。 Prometheus 采用的是 pull 的方案,配置之后会按照规则定时获取 metrics 并存储到 TSDB 中,TSDB 可以序列化到本地(SSD 比较好)。
1.3. UI 显示
Promethues 有自己的 Web UI,但是比较简陋。业内的做法是对接 Grafana 显示数据。Grafana 提供了丰富的 Dashboards,直接导入即可。
1.4. 告警
Grafana 自身是支持告警的,但是比较蛋疼的点在于告警规则不支持模板变量,那就约等于没有了···
业内常用的做法是使用 Alertmanager,它提供了多种告警策略,甚至包含了 Webhook 的方式(自定义告警、对接自有的告警系统)。
1.5. 示例:本机系统监控平台搭建
示例限于 Linux 平台,我使用 Ubuntu 18.04 测试搭建,不同的平台安装方式 node_exporter 安装方式略有不同,但大同小异。
1.5.1. node_exporter
- 下载,在 https://github.com/prometheus/node_exporter release 中找对应系统的安装包下载。
二进制包拷贝到
/user/local/bin/目录下 - systemd 配置 daemon 运行,和自启动
- examples 有配置文件范例可参考,注意设置一个有效的
user,不然会提示权限不足 - 设置开机启动:
systemctl enable node_exporter
- examples 有配置文件范例可参考,注意设置一个有效的
node_exporter 默认的服务端口是 9100 ,浏览器访问: 127.0.0.1:9100 即可查看暴露的 metric。
1.5.2. Prometheus
使用 Docker 部署。下载镜像: docker pull prom/prometheus:v2.16.0
创建 /data/storage 目录用来存储 TSDB 内容,创建 /data/prometheus 放置 promethues 配置文件。
注意:要授权成 65534, prometheus 运行的用户和组是 nobody/nogroup ,对用的 UID 和 GID 是 65534,这是一种简单的方法。
也可以在宿主机上创建一个用户,然后传给容器。
添加配置文件:
global:
  scrape_interval:     15s # Set the scrape interval to every 15 seconds. Default is every 1 minute.
  evaluation_interval: 15s # Evaluate rules every 15 seconds. The default is every 1 minute.
  # scrape_timeout is set to the global default (10s).

# Alertmanager configuration
alerting:
  alertmanagers:
  - static_configs:
    - targets:
      # - alertmanager:9093

# Load rules once and periodically evaluate them according to the global 'evaluation_interval'.
rule_files:
  # - "first_rules.yml"
  # - "second_rules.yml"

# A scrape configuration containing exactly one endpoint to scrape:
# Here it's Prometheus itself.
scrape_configs:
  # The job name is added as a label `job=<job_name>` to any timeseries scraped from this config.
  - job_name: 'prometheus'

    # metrics_path defaults to '/metrics'
    # scheme defaults to 'http'.

    static_configs:
    - targets: ['localhost:9090']
创建容器:
sudo docker run -it -d --restart=always -p 9090:9090 --name prometheus \
     -v /data/prometheus/prometheus.yml:/prometheus.yml -v /data/storage/:/data/storage/ \
     prom/prometheus:v2.16.0  \
     --config.file="/prometheus.yml" --storage.tsdb.path="/data/storage" --web.enable-lifecycle
然后在 http://127.0.0.1:9090/graph 即可访问 web UI。
将之前 node_exporter 作为 job 添加到 prometheus 配置文件中。
- job_name: 'local-node'
  static_configs:
          - targets: ['192.168.2.101:9100']
注意要使用主机的 IP 地址,而不是 localhost 或者 127.0.0.1 ,因为运行在容器中,而不是本机。
修改完配置之后需要重启容器才能生效,数据已经被挂载到宿主机了,所以不会丢。
访问 http://127.0.0.1:9090/targets 可以看到 local-node target 表示添加成功。
CentOS 二进制安装:
https://copr.fedorainfracloud.org/coprs/ibotty/prometheus-exporters/
curl -Lo /etc/yum.repos.d/_copr_ibotty-prometheus-exporters.repo https://copr.fedorainfracloud.org/coprs/ibotty/prometheus-exporters/repo/epel-7/ibotty-prometheus-exporters-epel-7.repo
yum install node_exporter
1.5.3. Grafana
使用 Docker 部署, 下载镜像: sudo docker pull grafana/grafana:6.6.2
创建容器:
sudo docker run -it --restart=always -d -p 3000:3000 --name grafana grafana/grafana:6.6.2
浏览器访问: http://127.0.0.1:3000 初始的账号密码都是 admin 。
添加数据源 Prometheus,注意要写宿主机的 IP。
Grafana 官网提供了很多的 dashboards,找一个 node_exporter 的 dashboard ID 比如: 11074 ,在 Grafana 中导入即可(记得选择数据源)。
记忆 metric name 和 prometheus 表达式是挺难的,所以每次找一些现成的 dashboard,熟悉熟悉语法,然后自己再写就会简单许多。
2. 对接 Kubernetes
Kubernetes 原生暴露了很多的集群(节点、Job、Ingress、Namespace 等)的 metric,具体可以看 kubernetes/kube-state-metrics 。
google/cadvisor 对容器的资源使用情况(metric)进行暴露,是专门用来解决容器监控指标问题的。 它可以对接多种存储,包括 Prometheus,暴露的指标、类型、描述、单位等在 Monitoring cAdvisor with Prometheus 有说明。
cAdvisor 运行时选项 可作为配置参考,其中 --enable_load_reader=true 才能收集到 CPU 负载数据,否则都是 0。